
Overview
What
Kubernetes is an open-source container orchestration system for automating the deployment, scaling, and management of containerized applications.
Who
This guide is intended for developers, system administrators, and IT professionals who want to install and use Kubernetes on Debian 12 Bookworm.
Where
You can install Kubernetes on any machine running Debian 12 Bookworm, whether it's a physical machine or a virtual machine.
When
Install Kubernetes when you need to manage containerized applications at scale for development, testing, or production environments.
Why
Using Kubernetes on Debian 12 Bookworm has several pros and cons:
| Pros | Cons |
|---|---|
|
|
How
Follow these steps to install Kubernetes on Debian 12 Bookworm:
| Step 1 | Update your system. |
| Step 2 | Install dependencies. |
| Step 3 | Add Kubernetes repository. |
| Step 4 | Install Kubernetes. |
| Step 5 | Initialize Kubernetes cluster. |
| Step 6 | Set up your Kubernetes configuration. |
| Step 7 | Deploy a pod network. |
Consequences
Installing and using Kubernetes on Debian 12 Bookworm can have several consequences:
| Positive |
|
| Negative |
|
Conclusion
Kubernetes is a powerful tool for managing containerized applications at scale. While it has some drawbacks, its benefits in autom
Install and Pre-Configure
Install Kubeadm to Configure Multi Nodes Kubernetes Cluster. This example is based on the environment like follows. For System requirements, each Node has unique Hostname, MAC address, Product_uuid. MAC address and Product_uuid are generally already unique one if you installed OS on physical machine or virtual machine with common procedure. You can see Product_uuid with the command [dmidecode -s system-uuid].
-----------+---------------------------+--------------------------+------------
           |                           |                          |
       eth0|10.0.0.25              eth0|10.0.0.71             eth0|10.0.0.72
+----------+-----------+   +-----------+-----------+   +----------+------------+
| [ ctrl.bizantum.lab] |   |[snode01.bizantum.lab] |   |[snode02.bizantum.lab] |
|     Control Plane    |   |      Worker Node      |   |      Worker Node      |
+----------------------+   +-----------------------+   +-----------------------+
Step [1]Install Containerd and apply some requirements on all Nodes.
root@ctrl:~# apt -y install containerd iptables apt-transport-https gnupg2 curl sudo
root@ctrl:~# containerd config default | tee /etc/containerd/config.toml
root@ctrl:~# vi /etc/containerd/config.toml
# line 61 : change
sandbox_image = "registry.k8s.io/pause:3.9"

# line 125 : change
SystemdCgroup = true

root@dlp:~# systemctl restart containerd.service
root@ctrl:~# cat > /etc/sysctl.d/99-k8s-cri.conf <<EOF
net.bridge.bridge-nf-call-iptables=1
net.bridge.bridge-nf-call-ip6tables=1
net.ipv4.ip_forward=1
EOF
root@ctrl:~# sysctl --system
root@ctrl:~# modprobe overlay; modprobe br_netfilter
root@ctrl:~# echo -e overlay\\nbr_netfilter > /etc/modules-load.d/k8s.conf
# needs [iptables-legacy] for iptables backend
# if nftables is enabled, change to [iptables-legacy]
root@ctrl:~# update-alternatives --config iptables
There are 2 choices for the alternative iptables (providing /usr/sbin/iptables).

  Selection    Path                       Priority   Status
------------------------------------------------------------
* 0            /usr/sbin/iptables-nft      20        auto mode
  1            /usr/sbin/iptables-legacy   10        manual mode
  2            /usr/sbin/iptables-nft      20        manual mode

Press <enter> to keep the current choice[*], or type selection number: 1
update-alternatives: using /usr/sbin/iptables-legacy to provide /usr/sbin/iptables (iptables) in manual mode

# disable swap
root@ctrl:~# swapoff -a
root@ctrl:~# vi /etc/fstab
# comment out
#/dev/mapper/debian--vg-swap_1 none            swap    sw              0       0
Step [2]Install Kubeadm, Kubelet, Kubectl on all Nodes.
root@ctrl:~# curl -fsSL https://pkgs.k8s.io/core:/stable:/v1.30/deb/Release.key | gpg --dearmor -o /etc/apt/keyrings/kubernetes-apt-keyring.gpg
root@ctrl:~# echo "deb [signed-by=/etc/apt/keyrings/kubernetes-apt-keyring.gpg] https://pkgs.k8s.io/core:/stable:/v1.30/deb/ /" | tee /etc/apt/sources.list.d/kubernetes.list
root@ctrl:~# apt update
root@ctrl:~# apt -y install kubeadm kubelet kubectl
root@ctrl:~# ln -s /opt/cni/bin /usr/lib/cni
Configure Control Plane Node
Install Kubeadm to Configure Multi Nodes Kubernetes Cluster. This example is based on the environment like follows.
-----------+---------------------------+--------------------------+------------
           |                           |                          |
       eth0|10.0.0.25              eth0|10.0.0.71             eth0|10.0.0.72
+----------+-----------+   +-----------+------------+   +---------+--------------+
|[ ctrl.bizantum.lab ] |   | [snode01.bizantum.lab] |   | [snode02.bizantum.lab] |
|     Control Plane    |   |      Worker Node       |   |      Worker Node       |
+----------------------+   +------------------------+   +------------------------+
Step [1]Configure pre-requirements on all Nodes, refer to here
Step [2]Configure initial setup on Control Plane Node. For [control-plane-endpoint], specify the Hostname or IP address that Etcd and Kubernetes API server are run. For [--pod-network-cidr] option, specify network which Pod Network uses. There are some plugins for Pod Network. On this example, it uses Calico. For details about networking see here.
root@ctrl:~# kubeadm init --control-plane-endpoint=10.0.0.25 --pod-network-cidr=192.168.0.0/16 --cri-socket=unix:///run/containerd/containerd.sock
[init] Using Kubernetes version: v1.30.3
[preflight] Running pre-flight checks
[preflight] Pulling images required for setting up a Kubernetes cluster
[preflight] This might take a minute or two, depending on the speed of your internet connection
[preflight] You can also perform this action in beforehand using 'kubeadm config images pull'
[certs] Using certificateDir folder "/etc/kubernetes/pki"
[certs] Generating "ca" certificate and key
[certs] Generating "apiserver" certificate and key
[certs] apiserver serving cert is signed for DNS names [ctrl.bizantum.lab kubernetes kubernetes.default kubernetes.default.svc kubernetes.default.svc.cluster.local] and IPs [10.96.0.1 10.0.0.25]

.....
.....

Your Kubernetes control-plane has initialized successfully!

To start using your cluster, you need to run the following as a regular user:

  mkdir -p $HOME/.kube
  sudo cp -i /etc/kubernetes/admin.conf $HOME/.kube/config
  sudo chown $(id -u):$(id -g) $HOME/.kube/config

Alternatively, if you are the root user, you can run:

  export KUBECONFIG=/etc/kubernetes/admin.conf

You should now deploy a pod network to the cluster.
Run "kubectl apply -f [podnetwork].yaml" with one of the options listed at:
  https://kubernetes.io/docs/concepts/cluster-administration/addons/

You can now join any number of control-plane nodes by copying certificate authorities
and service account keys on each node and then running the following as root:

  kubeadm join 10.0.0.25:6443 --token wmgxmn.abjab1upv8da9bp5 \
        --discovery-token-ca-cert-hash sha256:6b0bceac20f9f9e4dea0c52d8ba3b50d565d7e59ddbdeee6fd7544d140ac78fe \
        --control-plane

Then you can join any number of worker nodes by running the following on each as root:

kubeadm join 10.0.0.25:6443 --token wmgxmn.abjab1upv8da9bp5 \
        --discovery-token-ca-cert-hash sha256:6b0bceac20f9f9e4dea0c52d8ba3b50d565d7e59ddbdeee6fd7544d140ac78fe

# set cluster admin user
# if you set common user as cluster admin, login with it and run [sudo cp/chown ***]
root@ctrl:~# mkdir -p $HOME/.kube
root@ctrl:~# cp -i /etc/kubernetes/admin.conf $HOME/.kube/config
root@ctrl:~# chown $(id -u):$(id -g) $HOME/.kube/config
Step [3]Configure Pod Network with Calico.
root@ctrl:~# wget https://raw.githubusercontent.com/projectcalico/calico/master/manifests/calico.yaml
root@ctrl:~# kubectl apply -f calico.yaml
poddisruptionbudget.policy/calico-kube-controllers created
serviceaccount/calico-kube-controllers created
serviceaccount/calico-node created
serviceaccount/calico-cni-plugin created
configmap/calico-config created
customresourcedefinition.apiextensions.k8s.io/bgpconfigurations.crd.projectcalico.org created
customresourcedefinition.apiextensions.k8s.io/bgpfilters.crd.projectcalico.org created
customresourcedefinition.apiextensions.k8s.io/bgppeers.crd.projectcalico.org created
customresourcedefinition.apiextensions.k8s.io/blockaffinities.crd.projectcalico.org created
customresourcedefinition.apiextensions.k8s.io/caliconodestatuses.crd.projectcalico.org created
customresourcedefinition.apiextensions.k8s.io/clusterinformations.crd.projectcalico.org created
customresourcedefinition.apiextensions.k8s.io/felixconfigurations.crd.projectcalico.org created
customresourcedefinition.apiextensions.k8s.io/globalnetworkpolicies.crd.projectcalico.org created
customresourcedefinition.apiextensions.k8s.io/globalnetworksets.crd.projectcalico.org created
customresourcedefinition.apiextensions.k8s.io/hostendpoints.crd.projectcalico.org created
customresourcedefinition.apiextensions.k8s.io/ipamblocks.crd.projectcalico.org created
customresourcedefinition.apiextensions.k8s.io/ipamconfigs.crd.projectcalico.org created
customresourcedefinition.apiextensions.k8s.io/ipamhandles.crd.projectcalico.org created
customresourcedefinition.apiextensions.k8s.io/ippools.crd.projectcalico.org created
customresourcedefinition.apiextensions.k8s.io/ipreservations.crd.projectcalico.org created
customresourcedefinition.apiextensions.k8s.io/kubecontrollersconfigurations.crd.projectcalico.org created
customresourcedefinition.apiextensions.k8s.io/networkpolicies.crd.projectcalico.org created
customresourcedefinition.apiextensions.k8s.io/networksets.crd.projectcalico.org created
clusterrole.rbac.authorization.k8s.io/calico-kube-controllers created
clusterrole.rbac.authorization.k8s.io/calico-node created
clusterrole.rbac.authorization.k8s.io/calico-cni-plugin created
clusterrolebinding.rbac.authorization.k8s.io/calico-kube-controllers created
clusterrolebinding.rbac.authorization.k8s.io/calico-node created
clusterrolebinding.rbac.authorization.k8s.io/calico-cni-plugin created
daemonset.apps/calico-node created
deployment.apps/calico-kube-controllers created

# show state : OK if STATUS = Ready
root@ctrl:~# kubectl get nodes
NAME                STATUS   ROLES           AGE    VERSION
ctrl.bizantum.lab   Ready    control-plane   2m9s   v1.30.3

# show state : OK if all pods are Running
root@ctrl:~# kubectl get pods -A
NAMESPACE     NAME                                          READY   STATUS    RESTARTS   AGE
kube-system   calico-kube-controllers-86996b59f4-8zjlx      1/1     Running   0          35s
kube-system   calico-node-9kklj                             1/1     Running   0          35s
kube-system   coredns-7db6d8ff4d-jmdnv                      1/1     Running   0          2m7s
kube-system   coredns-7db6d8ff4d-klrl7                      1/1     Running   0          2m7s
kube-system   etcd-ctrl.bizantum.lab                        1/1     Running   0          2m21s
kube-system   kube-apiserver-ctrl.bizantum.lab              1/1     Running   0          2m21s
kube-system   kube-controller-manager-ctrl.bizantum.lab     1/1     Running   0          2m21s
kube-system   kube-proxy-gpkt2                              1/1     Running   0          2m7s
kube-system   kube-scheduler-ctrl.bizantum.lab              1/1     Running   0          2m21s
Configure Worker
Install Kubeadm to Configure Multi Nodes Kubernetes Cluster. This example is based on the environment like follows.
-----------+---------------------------+--------------------------+------------
           |                           |                          |
       eth0|10.0.0.25              eth0|10.0.0.71             eth0|10.0.0.72
+----------+------------+   +----------+-------------+   +--------+---------------+
| [ ctrl.bizantum.lab ] |   | [snode01.bizantum.lab] |   | [snode02.bizantum.lab] |
|     Control Plane     |   |      Worker Node       |   |      Worker Node       |
+-----------------------+   +------------------------+   +------------------------+
Step [1] Configure pre-requirements on all Nodes, refer to here.
Step [2]Join in Kubernetes Cluster which is initialized on Control Plane Node. The command for joining is just the one [kubeadm join ***] which was shown on the bottom of the results on initial setup of Cluster.
root@snode01:~# kubeadm join 10.0.0.25:6443 --token wmgxmn.abjab1upv8da9bp5 \
--discovery-token-ca-cert-hash sha256:6b0bceac20f9f9e4dea0c52d8ba3b50d565d7e59ddbdeee6fd7544d140ac78fe
[preflight] Running pre-flight checks
[preflight] Reading configuration from the cluster...
[preflight] FYI: You can look at this config file with 'kubectl -n kube-system get cm kubeadm-config -o yaml'
[kubelet-start] Writing kubelet configuration to file "/var/lib/kubelet/config.yaml"
[kubelet-start] Writing kubelet environment file with flags to file "/var/lib/kubelet/kubeadm-flags.env"
[kubelet-start] Starting the kubelet
[kubelet-check] Waiting for a healthy kubelet. This can take up to 4m0s
[kubelet-check] The kubelet is healthy after 501.334654ms
[kubelet-start] Waiting for the kubelet to perform the TLS Bootstrap

This node has joined the cluster:
* Certificate signing request was sent to apiserver and a response was received.
* The Kubelet was informed of the new secure connection details.

Run 'kubectl get nodes' on the control-plane to see this node join the cluster.
# OK if the message above is shown
Step [3]Verify Status on Control Plane Node. That's Ok if all STATUS are Ready.
root@ctrl:~# kubectl get nodes
NAME                   STATUS   ROLES           AGE     VERSION
ctrl.bizantum.lab      Ready    control-plane   12m     v1.30.3
snode01.bizantum.lab   Ready    <none>    3m57s   v1.30.3
snode02.bizantum.lab   Ready    <none>    95s     v1.30.3
Deploy Pods
This is the basic operation to create pods and others on Kubernetes Cluster. This example is based on the environment like follows.
-----------+---------------------------+--------------------------+------------
           |                           |                          |
       eth0|10.0.0.25              eth0|10.0.0.71             eth0|10.0.0.72
+-----------+-----------+   +----------+-------------+   +--------+---------------+
| [ ctrl.bizantum.lab ] |   | [snode01.bizantum.lab] |   | [snode02.bizantum.lab] |
|     Control Plane     |   |      Worker Node       |   |      Worker Node       |
+-----------------------+   +------------------------+   +------------------------+
Step [1]Create or Delete Pods.
# run [test-nginx] pods
root@ctrl:~# kubectl create deployment test-nginx --image=nginx
deployment.apps/test-nginx created
root@ctrl:~# kubectl get pods
NAME                          READY   STATUS    RESTARTS   AGE
test-nginx-6b4d69f6f8-t7zgw   1/1     Running   0          35s

# show environment variable for [test-nginx] pod
root@ctrl:~# kubectl exec test-nginx-6b4d69f6f8-t7zgw -- env
PATH=/usr/local/sbin:/usr/local/bin:/usr/sbin:/usr/bin:/sbin:/bin
HOSTNAME=test-nginx-6b4d69f6f8-t7zgw
NGINX_VERSION=1.25.1
NJS_VERSION=0.7.12
PKG_RELEASE=1~bookworm
KUBERNETES_PORT_443_TCP_PROTO=tcp
KUBERNETES_PORT_443_TCP_PORT=443
KUBERNETES_PORT_443_TCP_ADDR=10.96.0.1
KUBERNETES_SERVICE_HOST=10.96.0.1
KUBERNETES_SERVICE_PORT=443
KUBERNETES_SERVICE_PORT_HTTPS=443
KUBERNETES_PORT=tcp://10.96.0.1:443
KUBERNETES_PORT_443_TCP=tcp://10.96.0.1:443
HOME=/root

# shell access to [test-nginx] pod
root@ctrl:~# kubectl exec -it test-nginx-6b4d69f6f8-t7zgw -- bash
root@test-nginx-6b4d69f6f8-t7zgw:/# hostname
test-nginx-6b4d69f6f8-t7zgw
root@test-nginx-6b4d69f6f8-t7zgw:/# exit
# show logs of [test-nginx] pod
root@ctrl:~# kubectl logs test-nginx-6b4d69f6f8-t7zgw
/docker-entrypoint.sh: /docker-entrypoint.d/ is not empty, will attempt to perform configuration
/docker-entrypoint.sh: Looking for shell scripts in /docker-entrypoint.d/
/docker-entrypoint.sh: Launching /docker-entrypoint.d/10-listen-on-ipv6-by-default.sh
10-listen-on-ipv6-by-default.sh: info: Getting the checksum of /etc/nginx/conf.d/default.conf
10-listen-on-ipv6-by-default.sh: info: Enabled listen on IPv6 in /etc/nginx/conf.d/default.conf
/docker-entrypoint.sh: Sourcing /docker-entrypoint.d/15-local-resolvers.envsh
/docker-entrypoint.sh: Launching /docker-entrypoint.d/20-envsubst-on-templates.sh
/docker-entrypoint.sh: Launching /docker-entrypoint.d/30-tune-worker-processes.sh
/docker-entrypoint.sh: Configuration complete; ready for start up
2023/07/28 05:02:26 [notice] 1#1: using the "epoll" event method
2023/07/28 05:02:26 [notice] 1#1: nginx/1.25.1
2023/07/28 05:02:26 [notice] 1#1: built by gcc 12.2.0 (Debian 12.2.0-14)
2023/07/28 05:02:26 [notice] 1#1: OS: Linux 6.1.0-9-amd64
.....
.....

# scale out pods
root@ctrl:~# kubectl scale deployment test-nginx --replicas=3
deployment.extensions/test-nginx scaled
root@ctrl:~# kubectl get pods -o wide
NAME                          READY   STATUS    RESTARTS   AGE     IP                NODE                   NOMINATED NODE   READINESS GATES
test-nginx-6b4d69f6f8-l9lr2   1/1     Running   0          34s     192.168.211.130   snode02.bizantum.lab   <none>     <none>
test-nginx-6b4d69f6f8-p98xj   1/1     Running   0          34s     192.168.186.65    snode01.bizantum.lab   <none>     <none>
test-nginx-6b4d69f6f8-t7zgw   1/1     Running   0          3m29s   192.168.211.129   snode02.bizantum.lab   <none>     <none>

# set service
root@ctrl:~# kubectl expose deployment test-nginx --type="NodePort" --port 80
service "test-nginx" exposed
root@ctrl:~# kubectl get services test-nginx
NAME         TYPE       CLUSTER-IP     EXTERNAL-IP   PORT(S)        AGE
test-nginx   NodePort   10.105.13.79   <none>  80:30727/TCP   5s

# verify accesses
root@ctrl:~# curl 10.105.13.79
<!DOCTYPE html>
<html>
<head>
<title>Welcome to nginx!</title>
.....
.....
<p><em>Thank you for using nginx.</em></p>
</body>
</html>

# delete service
root@ctrl:~# kubectl delete services test-nginx
service "test-nginx" deleted
# delete pods
root@ctrl:~# kubectl delete deployment test-nginx
deployment.extensions "test-nginx" deleted
Use External Storage
Configure Persistent Storage in Kubernetes Cluster. This example is based on the environment like follows. For example, run NFS Server on Control Plane Node and configure Pods can use NFS area as external storage.
-----------+---------------------------+--------------------------+------------
           |                           |                          |
       eth0|10.0.0.25              eth0|10.0.0.71             eth0|10.0.0.72
+----------+------------+   +----------+-------------+   +--------+---------------+
| [ ctrl.bizantum.lab ] |   | [snode01.bizantum.lab] |   | [snode02.bizantum.lab] |
|     Control Plane     |   |      Worker Node       |   |      Worker Node       |
+-----------------------+   +------------------------+   +------------------------+
Step [1] Run NFS Server on Control Plane Node, refer to here. On this example, configure [/home/nfsshare] directory as NFS share.
Step [2] Create PV (Persistent Volume) object and PVC (Persistent Volume Claim) object on Control Plane Node.
# create PV definition
root@ctrl:~# vi nfs-pv.yml
apiVersion: v1
kind: PersistentVolume
metadata:
  # any PV name
  name: nfs-pv
spec:
  capacity:
    # storage size
    storage: 10Gi
  accessModes:
    # Access Modes:
    # - ReadWriteMany (RW from multi nodes)
    # - ReadWriteOnce (RW from a node)
    # - ReadOnlyMany (R from multi nodes)
    - ReadWriteMany
  persistentVolumeReclaimPolicy:
    # retain even if pods terminate
    Retain
  nfs:
    # NFS server's definition
    path: /home/nfsshare
    server: 10.0.0.25
    readOnly: false

root@ctrl:~# kubectl create -f nfs-pv.yml
persistentvolume "nfs-pv" created
root@ctrl:~# kubectl get pv
NAME     CAPACITY   ACCESS MODES   RECLAIM POLICY   STATUS      CLAIM   STORAGECLASS   REASON   AGE
nfs-pv   10Gi       RWX            Retain           Available                                   5s

# create PVC definition
root@ctrl:~# vi nfs-pvc.yml
apiVersion: v1
kind: PersistentVolumeClaim
metadata:
  # any PVC name
  name: nfs-pvc
spec:
  accessModes:
  - ReadWriteMany
  resources:
     requests:
       storage: 10Gi

root@ctrl:~# kubectl create -f nfs-pvc.yml
persistentvolumeclaim "nfs-pvc" created
root@ctrl:~# kubectl get pvc
NAME      STATUS   VOLUME   CAPACITY   ACCESS MODES   STORAGECLASS   AGE
nfs-pvc   Bound    nfs-pv   10Gi       RWX                           11s
Step [3]Create Pods with PVC above.
root@ctrl:~# vi nginx-nfs.yml
apiVersion: apps/v1
kind: Deployment
metadata:
  # any Deployment name
  name: nginx-nfs
  labels:
    name: nginx-nfs
spec:
  replicas: 3
  selector:
    matchLabels:
      app: nginx-nfs
  template:
    metadata:
      labels:
        app: nginx-nfs
    spec:
      containers:
      - name: nginx-nfs
        image: nginx
        ports:
          - name: web
            containerPort: 80
        volumeMounts:
          - name: nfs-share
            # mount point in container
            mountPath: /usr/share/nginx/html
      volumes:
        - name: nfs-share
          persistentVolumeClaim:
            # PVC name you created
            claimName: nfs-pvc

root@ctrl:~# kubectl create -f nginx-nfs.yml
deployment.apps/nginx-nfs created
root@ctrl:~# kubectl get pods -o wide
NAME                        READY   STATUS    RESTARTS   AGE   IP                NODE                   NOMINATED NODE   READINESS GATES
nginx-nfs-6bbbb89cd-b8lq8   1/1     Running   0          70s   192.168.211.132   snode02.bizantum.lab   <none>     <none>
nginx-nfs-6bbbb89cd-k5x82   1/1     Running   0          70s   192.168.186.66    snode01.bizantum.lab   <none>     <none>
nginx-nfs-6bbbb89cd-mftcj   1/1     Running   0          70s   192.168.211.131   snode02.bizantum.lab   <none>     <none>

root@ctrl:~# kubectl expose deployment nginx-nfs --type="NodePort" --port 80
service/nginx-nfs exposed
root@ctrl:~# kubectl get service nginx-nfs
NAME        TYPE       CLUSTER-IP     EXTERNAL-IP         PORT(S)        AGE
nginx-nfs   NodePort   10.103.43.15   <none>        80:30417/TCP   4s

# create a test file under the NFS shared directory
root@ctrl:~# echo 'NFS Persistent Storage Test' > /home/nfsshare/index.html
# verify accesses
root@ctrl:~# curl 10.103.43.15
NFS Persistent Storage Test
Configure Private Registry
Configure Private Registry to pull container images from self Private Registry. This example is based on the environment like follows.
-----------+---------------------------+--------------------------+------------
           |                           |                          |
       eth0|10.0.0.25              eth0|10.0.0.71             eth0|10.0.0.72
+----------+------------+   +----------+-------------+   +--------+---------------+
| [ ctrl.bizantum.lab ] |   | [snode01.bizantum.lab] |   | [snode02.bizantum.lab] |
|     Control Plane     |   |      Worker Node       |   |      Worker Node       |
+-----------------------+   +------------------------+   +------------------------+
Step [1]On a Node you'd like to run Private Registry Pod, Configure Registry with basic authentication and HTTPS connection (with valid certificate), refer to here. On this example, Registry Pod is running on Control Plane Node.
Step [2]Add Secret in Kubernetes.
root@ctrl:~# podman ps
CONTAINER ID  IMAGE                         COMMAND               CREATED         STATUS             PORTS                   NAMES
551b0044ab60  docker.io/library/registry:2  /etc/docker/regis...  15 seconds ago  Up 15 seconds ago  0.0.0.0:5000->5000/tcp  trusting_yalow

# login to the Registry once with a user
root@ctrl:~# podman login ctrl.bizantum.lab:5000
Username: debian
Password:
Login Succeeded!
# then following file is generated
root@ctrl:~# ll /run/user/0/containers/auth.json
-rw------- 1 root root 83 Jul 28 00:30 /run/user/0/containers/auth.json
# BASE64 encode of the file
root@ctrl:~# cat /run/user/0/containers/auth.json | base64
ewoJImF1dGhzIjogewoJCSJjdHJsLnNy.....
root@ctrl:~# vi regcred.yml
# create new
# specify contents of BASE64 encoding above with one line for [.dockerconfigjson] section
apiVersion: v1
kind: Secret
data:
  .dockerconfigjson: ewoJImF1dGhzIjogewoJCSJjdHJsLnNy.....
metadata:
  name: regcred
type: kubernetes.io/dockerconfigjson

root@ctrl:~# kubectl create -f regcred.yml
secret "regcred" created
root@ctrl:~# kubectl get secrets
NAME      TYPE                             DATA   AGE
regcred   kubernetes.io/dockerconfigjson   1      4s
Step [3]To pull images from self Private Registry, Specify private image and Secret when deploying pods like follows.
root@ctrl:~# podman images
REPOSITORY                     TAG          IMAGE ID      CREATED      SIZE
docker.io/library/nginx        latest       89da1fb6dcb9  3 hours ago  191 MB
ctrl.bizantum.lab:5000/nginx   my-registry  89da1fb6dcb9  3 hours ago  191 MB
docker.io/library/registry  2               4bb5ea59f8e0  6 weeks ago  24.6 MB

root@ctrl:~# vi private-nginx.yml
apiVersion: v1
kind: Pod
metadata:
  name: private-nginx
spec:
  containers:
  - name: private-nginx
    # image on Private Registry
    image: ctrl.bizantum.lab:5000/nginx:my-registry
  imagePullSecrets:
  # Secret name you added
  - name: regcred

root@ctrl:~# kubectl create -f private-nginx.yml
pod "private-nginx" created
root@ctrl:~# kubectl get pods
NAME            READY   STATUS    RESTARTS   AGE
private-nginx   1/1     Running   0          8s

root@ctrl:~# kubectl describe pods private-nginx
Name:             private-nginx
Namespace:        default
Priority:         0
Service Account:  default
Node:             snode02.bizantum.lab/10.0.0.72
Start Time:       Fri, 28 Jul 2023 00:37:05 -0500
Labels:           <none>
Annotations:      cni.projectcalico.org/containerID: 66ed5e1eda39db0df3c2b7ece965fb2a6021ab8321eb25ca4f6f06d1783acf27
                  cni.projectcalico.org/podIP: 192.168.211.133/32
                  cni.projectcalico.org/podIPs: 192.168.211.133/32
Status:           Running
IP:               192.168.211.133
IPs:
  IP:  192.168.211.133
Containers:
  private-nginx:
    Container ID:   containerd://b7358c3d60d6ed43a3fcca35248fbe04b70521973d23c1f573fbf94d16166a7c
    Image:          ctrl.bizantum.lab:5000/nginx:my-registry
    Image ID:       ctrl.bizantum.lab:5000/nginx@sha256:a126fb9d849c27d0dffa6d6a3b2b407d1184042f8291b8369579d8cd2b325db0
    Port:           <none>
    Host Port:      <none>
    State:          Running
      Started:      Fri, 28 Jul 2023 00:37:06 -0500
    Ready:          True
    Restart Count:  0
    Environment:    <none>
    Mounts:
      /var/run/secrets/kubernetes.io/serviceaccount from kube-api-access-cf6pg (ro)
.....
.....
Add Nodes
Add new Nodes to existing Kubernetes Cluster. This example is based on the environment like follows and add a new Node [snode03.bizantum.lab] to it.
-----------+---------------------------+--------------------------+------------
           |                           |                          |
       eth0|10.0.0.25              eth0|10.0.0.71             eth0|10.0.0.72
+----------+------------+   +----------+-------------+   +--------+---------------+
| [ ctrl.bizantum.lab ] |   | [snode01.bizantum.lab] |   | [snode02.bizantum.lab  |
|     Control Plane     |   |      Worker Node       |   |      Worker Node       |
+-----------------------+   +------------------------+   +------------------------+
Step [1] On a new Node, Configure common settings to join in Cluster, refer to here.
Step [2]Confirm join command on Control Plane Node.
root@ctrl:~# kubeadm token create --print-join-command
kubeadm join 10.0.0.25:6443 --token t1wink.nno4l3kni8q2w5u8 --discovery-token-ca-cert-hash sha256:1b96782423120e014e212197d34c56b029af1a8db85bf40a6602e19881bc7db1
Step [3]Run join command on a new Node.
root@snode03:~# kubeadm join 10.0.0.25:6443 --token t1wink.nno4l3kni8q2w5u8 \
--discovery-token-ca-cert-hash sha256:1b96782423120e014e212197d34c56b029af1a8db85bf40a6602e19881bc7db1
[preflight] Running pre-flight checks
[preflight] Reading configuration from the cluster...
[preflight] FYI: You can look at this config file with 'kubectl -n kube-system get cm kubeadm-config -o yaml'
[kubelet-start] Writing kubelet configuration to file "/var/lib/kubelet/config.yaml"
[kubelet-start] Writing kubelet environment file with flags to file "/var/lib/kubelet/kubeadm-flags.env"
[kubelet-start] Starting the kubelet
[kubelet-start] Waiting for the kubelet to perform the TLS Bootstrap...

This node has joined the cluster:
* Certificate signing request was sent to apiserver and a response was received.
* The Kubelet was informed of the new secure connection details.

Run 'kubectl get nodes' on the control-plane to see this node join the cluster.
Step [4]Verify settings on Control Plane Node. That's OK if the status of new Node turns to [STATUS = Ready].
root@ctrl:~# kubectl get nodes
NAME                   STATUS   ROLES              AGE     VERSION
ctrl.bizantum.lab      Ready    control-plane      5h44m   v1.26.6
snode01.bizantum.lab   Ready    <none>       51m     v1.26.6
snode02.bizantum.lab   Ready    <none>       50m     v1.26.6
snode03.bizantum.lab   Ready    <none>       76s     v1.26.6

root@ctrl:~# kubectl get pods -A -o wide | grep snode03
kube-system   calico-node-b9xkk                         1/1     Running   0          107s    10.0.0.73        snode03.bizantum.lab   <none>           <none>
kube-system   kube-proxy-86p6p                          1/1     Running   0          107s    10.0.0.73        snode03.bizantum.lab   <none>           <none>
Remove Nodes
Remove Nodes from existing Kubernetes Cluster. This example is based on the environment like follows and remove a Node [snode03.bizantum.lab] from it.
-----------+---------------------------+--------------------------+--------------+
           |                           |                          |              |
       eth0|10.0.0.25              eth0|10.0.0.71             eth0|10.0.0.72     |
+----------+------------+   +----------+-------------+   +--------+---------------+ |
| [ ctrl.bizantum.lab ] |   | [snode01.bizantum.lab] |   | [snode02.bizantum.lab] | |
|     Control Plane     |   |      Worker Node       |   |      Worker Node       | |
+-----------------------+   +------------------------+   +------------------------+ |
                                                                                 |
------------+--------------------------------------------------------------------+
            |
        eth0|10.0.0.73
+-----------+------------+
| [snode03.bizantum.lab] |
|      Worker Node       |
+------------------------+
Step [1]Remove a Node on Master Node.
# prepare to remove a target node
# --ignore-daemonsets ⇒ ignore pods in DaemonSet
# --delete-emptydir-data ⇒ ignore pods that has emptyDir volumes
# --force ⇒ also remove pods that was created as a pod, not as deployment or others
root@ctrl:~# kubectl drain snode03.bizantum.lab --ignore-daemonsets --delete-emptydir-data --force
Warning: ignoring DaemonSet-managed Pods: kube-system/calico-node-b9xkk, kube-system/kube-proxy-86p6p
node/snode03.bizantum.lab drained

# verify a few minutes later
root@ctrl:~# kubectl get nodes snode03.bizantum.lab
NAME                   STATUS                     ROLES          AGE    VERSION
snode03.bizantum.lab   Ready,SchedulingDisabled   <none>   6m4s   v1.26.6

# run delete method
root@ctrl:~# kubectl delete node snode03.bizantum.lab
node "snode03.bizantum.lab" deleted

root@ctrl:~# kubectl get nodes
NAME                   STATUS   ROLES                 AGE     VERSION
ctrl.bizantum.lab      Ready    control-plane         5h49m   v1.26.6
snode01.bizantum.lab   Ready    <none>          56m     v1.26.6
snode02.bizantum.lab   Ready    <none>          56m     v1.26.6
Step [2]On the removed Node, Reset kubeadm settings.
root@snode03:~# kubeadm reset
[reset] WARNING: Changes made to this host by 'kubeadm init' or 'kubeadm join' will be reverted.
[reset] Are you sure you want to proceed? [y/N]: y
[preflight] Running pre-flight checks
W0728 00:55:59.745953    5201 removeetcdmember.go:106] [reset] No kubeadm config, using etcd pod spec to get data directory
[reset] Deleted contents of the etcd data directory: /var/lib/etcd
[reset] Stopping the kubelet service
[reset] Unmounting mounted directories in "/var/lib/kubelet"
[reset] Deleting contents of directories: [/etc/kubernetes/manifests /var/lib/kubelet /etc/kubernetes/pki]
[reset] Deleting files: [/etc/kubernetes/admin.conf /etc/kubernetes/kubelet.conf /etc/kubernetes/bootstrap-kubelet.conf /etc/kubernetes/controller-manager.conf /etc/kubernetes/scheduler.conf]

The reset process does not clean CNI configuration. To do so, you must remove /etc/cni/net.d

The reset process does not reset or clean up iptables rules or IPVS tables.
If you wish to reset iptables, you must do so manually by using the "iptables" command.

If your cluster was setup to utilize IPVS, run ipvsadm --clear (or similar)
to reset your system's IPVS tables.

The reset process does not clean your kubeconfig files and you must remove them manually.
Please, check the contents of the $HOME/.kube/config file.
Enable Dashboard
Enable Dashboard to manage Kubernetes Cluster on Web UI. This example is based on the environment like follows.
-----------+---------------------------+--------------------------+------------
           |                           |                          |
       eth0|10.0.0.25              eth0|10.0.0.71            eth0|10.0.0.72
+----------+------------+   +----------+-------------+   +--------+---------------+
| [ ctrl.bizantum.lab ] |   | [snode01.bizantum.lab] |   | [snode02.bizantum.lab] |
|     Control Plane     |   |      Worker Node       |   |      Worker Node       |
+-----------------------+   +------------------------+   +------------------------+
Step [1]Enable Dashboard on Control Plane Node.
root@ctrl:~# kubectl apply -f https://raw.githubusercontent.com/kubernetes/dashboard/v2.7.0/aio/deploy/recommended.yaml
namespace/kubernetes-dashboard created
serviceaccount/kubernetes-dashboard created
service/kubernetes-dashboard created
secret/kubernetes-dashboard-certs created
secret/kubernetes-dashboard-csrf created
secret/kubernetes-dashboard-key-holder created
configmap/kubernetes-dashboard-settings created
role.rbac.authorization.k8s.io/kubernetes-dashboard created
clusterrole.rbac.authorization.k8s.io/kubernetes-dashboard created
rolebinding.rbac.authorization.k8s.io/kubernetes-dashboard created
clusterrolebinding.rbac.authorization.k8s.io/kubernetes-dashboard created
deployment.apps/kubernetes-dashboard created
service/dashboard-metrics-scraper created
deployment.apps/dashboard-metrics-scraper created
Step [2]Add an account for Dashboard management.
root@ctrl:~# kubectl create serviceaccount -n kubernetes-dashboard admin-user
serviceaccount/admin-user created
root@ctrl:~# vi rbac.yml
# create new
apiVersion: rbac.authorization.k8s.io/v1
kind: ClusterRoleBinding
metadata:
  name: admin-user
roleRef:
  apiGroup: rbac.authorization.k8s.io
  kind: ClusterRole
  name: cluster-admin
subjects:
- kind: ServiceAccount
  name: admin-user
  namespace: kubernetes-dashboard

root@ctrl:~# kubectl apply -f rbac.yml
clusterrolebinding.rbac.authorization.k8s.io/admin-user created
# get security token of the account above
root@ctrl:~# kubectl -n kubernetes-dashboard create token admin-user
eyJhbGciOiJSUzI1NiIsImtpZCI6I.....
# run kube-proxy
root@ctrl:~# kubectl proxy
Starting to serve on 127.0.0.1:8001
# if access from other client hosts, set port-forwarding
root@ctrl:~# kubectl port-forward -n kubernetes-dashboard service/kubernetes-dashboard --address 0.0.0.0 10443:443
Forwarding from 0.0.0.0:10443 -> 8443
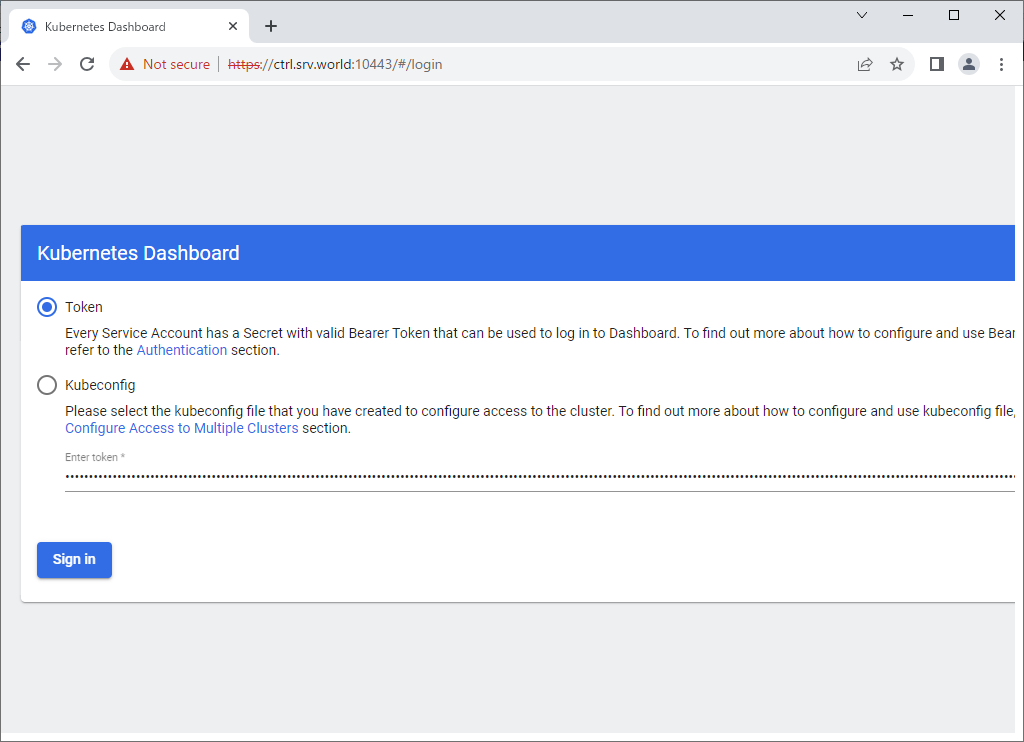
Step [3]If you run [kubectl proxy], access to the URL below with an Web browser on Localhost. ⇒ http://localhost:8001/api/v1/namespaces/kubernetes-dashboard/services/https:kubernetes-dashboard:/proxy/ If you set port-forwarding, access to the URL below on a client computer in your local network. ⇒ https://(Control Plane Node Hostname or IP address):(setting port)/ After displaying following form, Copy and paste the security token you got on [2] to [Enter token] section and Click [Sing In] button.
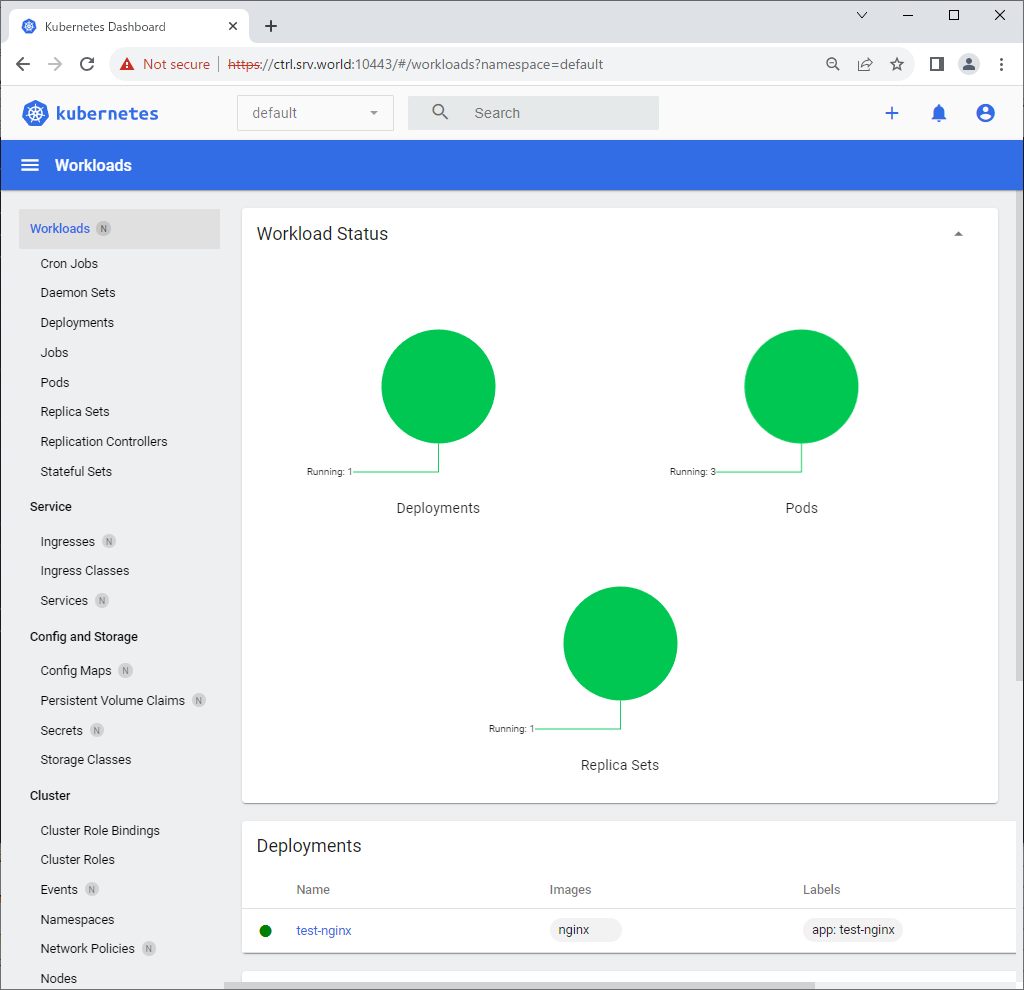
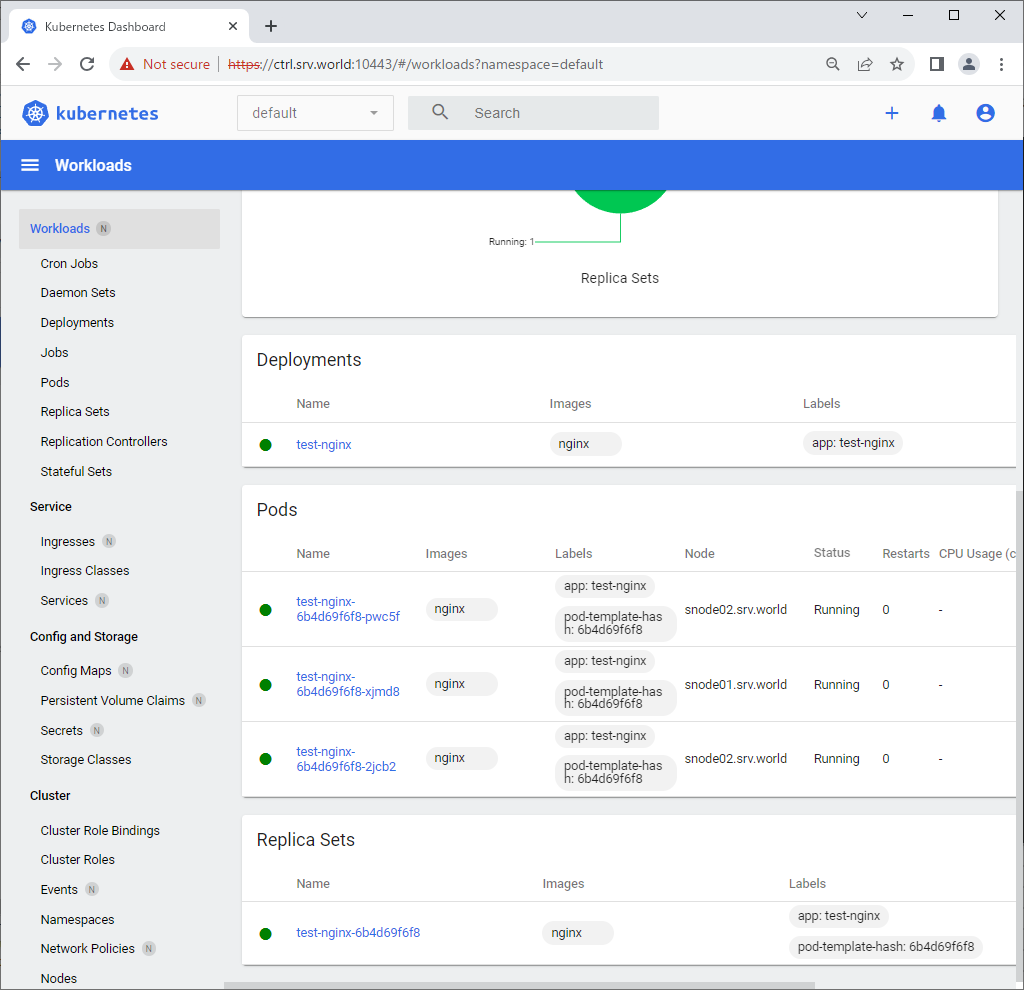
Step [4]After authentication successfully passed, Kubernetes Cluster Dashboard is displayed.
Deploy Metrics Server
Deploy Metrics Server to monitor CPU and Memory resources in Kubernetes Cluster. This example is based on the environment like follows.
-----------+---------------------------+--------------------------+------------
           |                           |                          |
       eth0|10.0.0.25              eth0|10.0.0.71             eth0|10.0.0.72
+----------+------------+   +----------+-------------+   +--------+---------------+
| [ ctrl.bizantum.lab ] |   | [snode01.bizantum.lab] |   | [snode02.bizantum.lab] |
|     Control Plane     |   |      Worker Node       |   |      Worker Node       |
+-----------------------+   +------------------------+   +------------------------+
Step [1]Deploy Metrics Server on Control Plane Node.
root@ctrl:~# git clone https://github.com/kubernetes-sigs/metrics-server
root@ctrl:~# vi ./metrics-server/manifests/base/deployment.yaml
.....
.....
 containers:
      - name: metrics-server
        image: gcr.io/k8s-staging-metrics-server/metrics-server:master
        imagePullPolicy: IfNotPresent
        # line 23 : add
        command:
        - /metrics-server
        - --kubelet-insecure-tls
        - --kubelet-preferred-address-types=InternalIP
        args:
          - --cert-dir=/tmp
          - --secure-port=10250
          - --kubelet-preferred-address-types=InternalIP,ExternalIP,Hostname
          - --kubelet-use-node-status-port
          - --metric-resolution=15s
.....
.....

root@ctrl:~# kubectl apply -k ./metrics-server/manifests/base/
serviceaccount/metrics-server created
clusterrole.rbac.authorization.k8s.io/system:aggregated-metrics-reader created
clusterrole.rbac.authorization.k8s.io/system:metrics-server created
rolebinding.rbac.authorization.k8s.io/metrics-server-auth-reader created
clusterrolebinding.rbac.authorization.k8s.io/metrics-server:system:auth-delegator created
clusterrolebinding.rbac.authorization.k8s.io/system:metrics-server created
service/metrics-server created
deployment.apps/metrics-server created
apiservice.apiregistration.k8s.io/v1beta1.metrics.k8s.io created

root@ctrl:~# kubectl get pods -n kube-system
NAME                                         READY   STATUS    RESTARTS   AGE
calico-kube-controllers-56dd5794f-r7fvl      1/1     Running   0          5h57m
calico-node-89s9h                            1/1     Running   0          5h57m
calico-node-txrgc                            1/1     Running   0          69m
calico-node-x8qvh                            1/1     Running   0          70m
coredns-787d4945fb-6nn4p                     1/1     Running   0          6h2m
coredns-787d4945fb-qwxb5                     1/1     Running   0          6h2m
etcd-ctrl.bizantum.lab                       1/1     Running   0          6h3m
kube-apiserver-ctrl.bizantum.lab             1/1     Running   0          6h3m
kube-controller-manager-ctrl.bizantum.lab    1/1     Running   0          6h3m
kube-proxy-fbfgj                             1/1     Running   0          6h2m
kube-proxy-gc6ff                             1/1     Running   0          69m
kube-proxy-zc2fn                             1/1     Running   0          70m
kube-scheduler-ctrl.bizantum.lab             1/1     Running   0          6h3m
metrics-server-5698b55c7d-q48zb              1/1     Running   0          50s
# [metrics-server] pod has been deployed
Step [2]To display CPU and Memory resources, run like follows.
root@ctrl:~# kubectl top node
NAME                   CPU(cores)   CPU%   MEMORY(bytes)   MEMORY%
ctrl.bizantum.lab      117m         1%     1731Mi          10%
snode01.bizantum.lab   27m          0%     907Mi           11%
snode02.bizantum.lab   37m          0%     1017Mi          6%

root@ctrl:~# kubectl top pod
NAME                          CPU(cores)   MEMORY(bytes)
test-nginx-6b4d69f6f8-2jcb2   0m           7Mi
test-nginx-6b4d69f6f8-pwc5f   0m           7Mi
test-nginx-6b4d69f6f8-xjmd8   0m           4Mi
Horizontal Pod Autoscaler
Configure Horizontal Pod Autoscaler to set auto scaling to Pods. This example is based on the environment like follows.
-----------+---------------------------+--------------------------+------------
           |                           |                          |
       eth0|10.0.0.25              eth0|10.0.0.71             eth0|10.0.0.72
+----------+------------+   +----------+-------------+   +--------+---------------+
| [ ctrl.bizantum.lab ] |   | [snode01.bizantum.lab] |   | [snode02.bizantum.lab] |
|     Control Plane     |   |      Worker Node       |   |      Worker Node       |
+-----------------------+   +------------------------+   +------------------------+
Step [1] Deploy Metrics Server, refer to here.
Step [2]This is an example of Deployment to set Horizontal Pod Autoscaler.
root@ctrl:~# vi my-nginx.yml
apiVersion: apps/v1
kind: Deployment
metadata:
  labels:
    run: my-nginx
  name: my-nginx
spec:
  replicas: 1
  selector:
    matchLabels:
      run: my-nginx
  template:
    metadata:
      labels:
        run: my-nginx
    spec:
      containers:
      - image: nginx
        name: my-nginx
        resources:
          # requests : set minimum required resources when creating pods
          requests:
            # 250m : 0.25 CPU
            cpu: 250m
            memory: 64Mi
          # set maximum resorces
          limits:
            cpu: 500m
            memory: 128Mi

root@ctrl:~# vi hpa.yml
apiVersion: autoscaling/v2
kind: HorizontalPodAutoscaler
metadata:
  name: my-nginx-hpa
  namespace: default
spec:
  scaleTargetRef:
    apiVersion: apps/v1
    kind: Deployment
    # target Deployment name
    name: my-nginx
  minReplicas: 1
  # maximum number of replicas
  maxReplicas: 4
  metrics:
  - type: Resource
    resource:
      # scale if target CPU utilization is over 20%
      name: cpu
      target:
        type: Utilization
        averageUtilization: 20

root@ctrl:~# kubectl apply -f my-nginx.yml -f hpa.yml
deployment.apps/my-nginx created
horizontalpodautoscaler.autoscaling/my-nginx-hpa created

# verify settings
root@ctrl:~# kubectl get pods
NAME                        READY   STATUS    RESTARTS   AGE
my-nginx-55f9ff4dc6-sfmtq   1/1     Running   0          7s

root@ctrl:~# kubectl top pod
NAME                        CPU(cores)   MEMORY(bytes)
my-nginx-55f9ff4dc6-sfmtq   0m           7Mi

# after creating, [TARGETS] value is [unknown]
root@ctrl:~# kubectl get hpa
NAME           REFERENCE             TARGETS              MINPODS   MAXPODS   REPLICAS   AGE
my-nginx-hpa   Deployment/my-nginx   <unknown>/20%     1         4         1       32s

# if some processes run in a pod, [TARGETS] value are gotten
root@ctrl:~# kubectl get hpa
NAME           REFERENCE             TARGETS   MINPODS   MAXPODS   REPLICAS   AGE
my-nginx-hpa   Deployment/my-nginx   0%/20%    1         4         1          58s

# run some processes in a pod manually and see current state of pods again
root@ctrl:~# kubectl get hpa
NAME           REFERENCE             TARGETS   MINPODS   MAXPODS   REPLICAS   AGE
my-nginx-hpa   Deployment/my-nginx   50%/20%   1         4         4          3m52s

# pods have been scaled for settings
root@ctrl:~# kubectl get pods
NAME                        READY   STATUS    RESTARTS   AGE
my-nginx-55f9ff4dc6-7zp5n   1/1     Running   0          57s
my-nginx-55f9ff4dc6-842tc   1/1     Running   0          57s
my-nginx-55f9ff4dc6-9w2tt   1/1     Running   0          57s
my-nginx-55f9ff4dc6-sfmtq   1/1     Running   0          3m57s

root@ctrl:~# kubectl top pod
NAME                        CPU(cores)   MEMORY(bytes)
my-nginx-55f9ff4dc6-7zp5n   0m           7Mi
my-nginx-55f9ff4dc6-842tc   0m           4Mi
my-nginx-55f9ff4dc6-9w2tt   0m           4Mi
my-nginx-55f9ff4dc6-sfmtq   59m          7Mi
Install Helm
Install Helm which helps to manage Kubernetes applications. This example is based on the environment like follows.
-----------+---------------------------+--------------------------+------------
           |                           |                          |
       eth0|10.0.0.25              eth0|10.0.0.71             eth0|10.0.0.72
+----------+------------+   +----------+-------------+   +--------+---------------+
| [ ctrl.bizantum.lab ] |   | [snode01.bizantum.lab] |   | [snode02.bizantum.lab] |
|     Control Plane     |   |      Worker Node       |   |      Worker Node       |
+-----------------------+   +------------------------+   +------------------------+
Step [1]Install Helm.
root@ctrl:~# curl -O https://raw.githubusercontent.com/helm/helm/main/scripts/get-helm-3
root@ctrl:~# bash ./get-helm-3
Downloading https://get.helm.sh/helm-v3.12.2-linux-amd64.tar.gz
Verifying checksum... Done.
Preparing to install helm into /usr/local/bin
helm installed into /usr/local/bin/helm
root@ctrl:~# helm version
version.BuildInfo{Version:"v3.12.2", GitCommit:"1e210a2c8cc5117d1055bfaa5d40f51bbc2e345e", GitTreeState:"clean", GoVersion:"go1.20.5"}
Step [2]Basic Usage of Helm.
# search charts by words in Helm Hub
root@ctrl:~# helm search hub wordpress
URL                                                     CHART VERSION   APP VERSION             DESCRIPTION
https://artifacthub.io/packages/helm/wordpress-...      1.0.2           1.0.0                   A Helm chart for deploying Wordpress+Mariadb st...
https://artifacthub.io/packages/helm/kube-wordp...      0.1.0           1.1                     this is my wordpress package
https://artifacthub.io/packages/helm/shubham-wo...      0.1.0           1.16.0                  A Helm chart for Kubernetes
.....
.....

# add repository
# example below is the official Helm Stable repository
root@ctrl:~# helm repo add stable https://charts.helm.sh/stable
"stable" has been added to your repositories
root@ctrl:~# helm repo add bitnami https://charts.bitnami.com/bitnami
"bitnami" has been added to your repositories
# display added repositories
root@ctrl:~# helm repo list
NAME    URL
stable  https://charts.helm.sh/stable
bitnami https://charts.bitnami.com/bitnami

# search charts by words in repository
root@ctrl:~# helm search repo stable
NAME                                    CHART VERSION   APP VERSION             DESCRIPTION
stable/acs-engine-autoscaler            2.2.2           2.1.1                   DEPRECATED Scales worker nodes within agent pools
stable/aerospike                        0.3.5           v4.5.0.5                DEPRECATED A Helm chart for Aerospike in Kubern...
stable/airflow                          7.13.3          1.10.12                 DEPRECATED - please use: https://github.com/air...
stable/ambassador                       5.3.2           0.86.1                  DEPRECATED A Helm chart for Datawire Ambassador
stable/anchore-engine                   1.7.0           0.7.3                   Anchore container analysis and policy evaluatio...
stable/apm-server                       2.1.7           7.0.0                   DEPRECATED The server receives data from the El...
.....
.....

# display description of a chart
# helm show [all|chart|readme|values] [chart name]
root@ctrl:~# helm show chart bitnami/wordpress
annotations:
  category: CMS
  licenses: Apache-2.0
apiVersion: v2
appVersion: 6.2.2
dependencies:
- condition: memcached.enabled
  name: memcached
  repository: oci://registry-1.docker.io/bitnamicharts
  version: 6.x.x
- condition: mariadb.enabled
  name: mariadb
  repository: oci://registry-1.docker.io/bitnamicharts
  version: 12.x.x
- name: common
  repository: oci://registry-1.docker.io/bitnamicharts
  tags:
  - bitnami-common
  version: 2.x.x
description: WordPress is the world's most popular blogging and content management
  platform. Powerful yet simple, everyone from students to global corporations use
  it to build beautiful, functional websites.
home: https://bitnami.com
icon: https://bitnami.com/assets/stacks/wordpress/img/wordpress-stack-220x234.png
keywords:
- application
- blog
- cms
- http
- php
- web
- wordpress
maintainers:
- name: VMware, Inc.
  url: https://github.com/bitnami/charts
name: wordpress
sources:
- https://github.com/bitnami/charts/tree/main/bitnami/wordpress
version: 16.1.34

# deploy application by specified chart
# helm install [any name] [chart name]
root@ctrl:~# helm install wordpress bitnami/wordpress
NAME: wordpress
LAST DEPLOYED: Fri Jul 28 01:28:20 2023
NAMESPACE: default
STATUS: deployed
REVISION: 1
TEST SUITE: None
NOTES:
CHART NAME: wordpress
CHART VERSION: 16.1.34
APP VERSION: 6.2.2

** Please be patient while the chart is being deployed **

Your WordPress site can be accessed through the following DNS name from within your cluster:

    wordpress.default.svc.cluster.local (port 80)

To access your WordPress site from outside the cluster follow the steps below:

1. Get the WordPress URL by running these commands:

  NOTE: It may take a few minutes for the LoadBalancer IP to be available.
        Watch the status with: 'kubectl get svc --namespace default -w wordpress'

   export SERVICE_IP=$(kubectl get svc --namespace default wordpress --template "{{ range (index .status.loadBalancer.ingress 0) }}{{ . }}{{ end }}")
   echo "WordPress URL: http://$SERVICE_IP/"
   echo "WordPress Admin URL: http://$SERVICE_IP/admin"

2. Open a browser and access WordPress using the obtained URL.

3. Login with the following credentials below to see your blog:

  echo Username: user
  echo Password: $(kubectl get secret --namespace default wordpress -o jsonpath="{.data.wordpress-password}" | base64 -d)

# display deployed applications
root@ctrl:~# helm list
NAME            NAMESPACE       REVISION        UPDATED                                 STATUS          CHART                  APP VERSION
wordpress       default         1               2023-07-28 01:28:20.140568936 -0500 CDT deployed        wordpress-16.1.34      6.2.2

# display status of a deployed apprication
root@ctrl:~# helm status wordpress
NAME: wordpress
LAST DEPLOYED: Fri Jul 28 01:28:20 2023
NAMESPACE: default
STATUS: deployed
REVISION: 1
TEST SUITE: None
NOTES:
CHART NAME: wordpress
CHART VERSION: 16.1.34
APP VERSION: 6.2.2
.....
.....

# uninstall a deployed application
root@ctrl:~# helm uninstall wordpress
release "registry" uninstalled
Dynamic Volume Provisioning (NFS)
To use Dynamic Volume Provisioning feature when using Persistent Storage, it's possible to create PV (Persistent Volume) dynamically without creating PV manually by Cluster Administrator when created PVC (Persistent Volume Claim) by users. This example is based on the environment like follows. For example, run NFS Server on Control Plane Node and configure dynamic volume provisioning with NFS provisioner.
-----------+---------------------------+--------------------------+------------
           |                           |                          |
       eth0|10.0.0.25              eth0|10.0.0.71             eth0|10.0.0.72
+----------+------------+   +----------+-------------+   +--------+---------------+
| [ ctrl.bizantum.lab ] |   | [snode01.bizantum.lab] |   | [snode02.bizantum.lab] |
|     Control Plane     |   |      Worker Node       |   |      Worker Node       |
+-----------------------+   +------------------------+   +------------------------+
Step [1] Run NFS Server on Control Plane Node, refer to here. On this example, configure [/home/nfsshare] directory as NFS share.
Step [2] Worker Nodes need to be able to mount NFS share on NFS server.
Step [3] Install NFS Client Provisioner with Helm.
root@ctrl:~# helm repo add nfs-subdir-external-provisioner https://kubernetes-sigs.github.io/nfs-subdir-external-provisioner/
# nfs.server = (NFS server's hostname or IP address)
# nfs.path = (NFS share Path)
root@ctrl:~# helm install nfs-client -n kube-system --set nfs.server=10.0.0.25 --set nfs.path=/home/nfsshare nfs-subdir-external-provisioner/nfs-subdir-external-provisioner
NAME: nfs-client
LAST DEPLOYED: Fri Jul 28 01:35:08 2023
NAMESPACE: kube-system
STATUS: deployed
REVISION: 1
TEST SUITE: None

root@ctrl:~# kubectl get pods -n kube-system
NAME                                                          READY   STATUS    RESTARTS       AGE
.....
.....
nfs-client-nfs-subdir-external-provisioner-8689b9b8c6-n4s2f   1/1     Running   0              28s
Step [4]This is an example to use dynamic volume provisioning by a Pod.
root@ctrl:~# kubectl get pv
No resources found in default namespace.
root@ctrl:~# kubectl get pvc
No resources found in default namespace.
root@ctrl:~# kubectl get storageclass
NAME         PROVISIONER                                                RECLAIMPOLICY   VOLUMEBINDINGMODE   ALLOWVOLUMEEXPANSION   AGE
nfs-client   cluster.local/nfs-client-nfs-subdir-external-provisioner   Delete          Immediate           true                   2m10s

# create PVC
root@ctrl:~# vi my-pvc.yml
apiVersion: v1
kind: PersistentVolumeClaim
metadata:
  name: my-provisioner
  annotations:
    # specify StorageClass name
    volume.beta.kubernetes.io/storage-class: nfs-client
spec:
  accessModes:
    - ReadWriteOnce
  resources:
    requests:
      # volume size
      storage: 5Gi

root@ctrl:~# kubectl apply -f my-pvc.yml
persistentvolumeclaim/my-provisioner created
root@ctrl:~# kubectl get pvc
NAME             STATUS   VOLUME                                     CAPACITY   ACCESS MODES   STORAGECLASS   AGE
my-provisioner   Bound    pvc-b3f9795c-95c6-4fc5-926c-80bdbc2e4296   5Gi        RWO            nfs-client     9s

# PV is generated dynamically
root@ctrl:~# kubectl get pv
NAME                                       CAPACITY   ACCESS MODES   RECLAIM POLICY   STATUS   CLAIM                    STORAGECLASS   REASON   AGE
pvc-b3f9795c-95c6-4fc5-926c-80bdbc2e4296   5Gi        RWO            Delete           Bound    default/my-provisioner   nfs-client              34s

root@ctrl:~# vi my-pod.yml
apiVersion: v1
kind: Pod
metadata:
  name: my-mginx
spec:
  containers:
    - name: my-mginx
      image: nginx
      ports:
        - containerPort: 80
          name: web
      volumeMounts:
      - mountPath: /usr/share/nginx/html
        name: nginx-pvc
  volumes:
    - name: nginx-pvc
      persistentVolumeClaim:
        # PVC name you created
        claimName: my-provisioner

root@ctrl:~# kubectl apply -f my-pod.yml
pod/my-mginx created
root@ctrl:~# kubectl get pod my-mginx -o wide
NAME       READY   STATUS    RESTARTS   AGE   IP                NODE                   NOMINATED NODE         READINESS GATES
my-mginx   1/1     Running   0          6s    192.168.211.142   snode02.bizantum.lab   <none>           <none>

root@ctrl:~# kubectl exec my-mginx -- df /usr/share/nginx/html
Filesystem                                                                                1K-blocks    Used     Available  Use%   Mounted on
10.0.0.25:/home/nfsshare/default-my-provisioner-pvc-b3f9795c-95c6-4fc5-926c-80bdbc2e4296  80503808     4645888  71723008   7%     /usr/share/nginx/html

# verify accessing to create test index file
root@ctrl:~# echo "Nginx Index" > index.html
root@ctrl:~# kubectl cp index.html my-mginx:/usr/share/nginx/html/index.html
root@ctrl:~# curl 192.168.211.142
Nginx Index
# when removing, to remove PVC, then PV is also removed dynamically
root@ctrl:~# kubectl delete pod my-mginx
pod "my-mginx" deleted
root@ctrl:~# kubectl delete pvc my-provisioner
persistentvolumeclaim "my-provisioner" deleted
root@ctrl:~# kubectl get pv
No resources found in default namespace.
Step [5]To use StatefulSet, it's possible to specify [volumeClaimTemplates].
root@ctrl:~# kubectl get pv
No resources found in default namespace.
root@ctrl:~# kubectl get pvc
No resources found in default namespace.
root@ctrl:~# kubectl get storageclass
NAME         PROVISIONER                                                RECLAIMPOLICY   VOLUMEBINDINGMODE   ALLOWVOLUMEEXPANSION   AGE
nfs-client   cluster.local/nfs-client-nfs-subdir-external-provisioner   Delete          Immediate           true                   6m54s

root@ctrl:~# vi statefulset.yml
apiVersion: apps/v1
kind: StatefulSet
metadata:
  name: my-mginx
spec:
  serviceName: my-mginx
  replicas: 1
  selector:
    matchLabels:
      app: my-mginx
  template:
    metadata:
      labels:
        app: my-mginx
    spec:
      containers:
      - name: my-mginx
        image: nginx
        volumeMounts:
        - name: data
          mountPath: /usr/share/nginx/html
  volumeClaimTemplates:
  - metadata:
      name: data
    spec:
      # specify StorageClass name
      storageClassName: nfs-client
      accessModes: [ "ReadWriteOnce" ]
      resources:
        requests:
          storage: 5Gi

root@ctrl:~# kubectl apply -f statefulset.yml
statefulset.apps/my-mginx created
root@ctrl:~# kubectl get statefulset
NAME       READY   AGE
my-mginx   1/1     10s

root@ctrl:~# kubectl get pods -o wide
NAME         READY   STATUS    RESTARTS   AGE   IP                NODE                   NOMINATED NODE         READINESS GATES
my-mginx-0   1/1     Running   0          17s   192.168.211.143   snode02.bizantum.lab   <none>           <none>

root@ctrl:~# kubectl get pvc
NAME              STATUS   VOLUME                                     CAPACITY   ACCESS MODES   STORAGECLASS   AGE
data-my-mginx-0   Bound    pvc-0eff9731-5cb6-4b75-9772-202d2f9d27f7   5Gi        RWO            nfs-client     45s

root@ctrl:~# kubectl get pv
NAME                                       CAPACITY   ACCESS MODES   RECLAIM POLICY   STATUS   CLAIM                     STORAGECLASS   REASON   AGE
pvc-0eff9731-5cb6-4b75-9772-202d2f9d27f7   5Gi        RWO            Delete           Bound    default/data-my-mginx-0   nfs-client              59s
Deploy Prometheus
Deploy Prometheus to monitor metrics in Kubernetes Cluster. This example is based on the environment like follows.
-----------+---------------------------+--------------------------+------------
           |                           |                          |
       eth0|10.0.0.25              eth0|10.0.0.71             eth0|10.0.0.72
+----------+------------+   +----------+-------------+   +--------+---------------+
| [ ctrl.bizantum.lab ] |   | [snode01.bizantum.lab] |   | [snode02.bizantum.lab] |
|     Control Plane     |   |      Worker Node       |   |      Worker Node       |
+-----------------------+   +------------------------+   +-------------------------+
Step [1] A Persistent storage is needed for Prometheus. On this example, install NFS Server on Control Plane Node and configure [/home/nfsshare] directory as NFS share as external persistent storage, and also configure dynamic volume provisioning with NFS plugin like the example of [1], [2], [3].
Step [2] Install Prometheus chart with Helm.
# output config and change some settings
root@ctrl:~# helm inspect values bitnami/kube-prometheus > prometheus.yaml
root@ctrl:~# vi prometheus.yaml
.....
.....
    line 21 : specify [storageClass] to use
    storageClass: "nfs-client"
.....
.....
.....
    line 1040 : specify [storageClass] to use
    storageClass: "nfs-client"
.....
.....
.....
    line 2002 : specify [storageClass] to use
    storageClass: "nfs-client"

# create a namespace for Prometheus
root@ctrl:~# kubectl create namespace monitoring
namespace/monitoring created
root@ctrl:~# helm install prometheus --namespace monitoring -f prometheus.yaml bitnami/kube-prometheus
NAME: prometheus
LAST DEPLOYED: Fri Jul 28 01:53:01 2023
NAMESPACE: monitoring
STATUS: deployed
REVISION: 1
TEST SUITE: None
NOTES:
CHART NAME: kube-prometheus
CHART VERSION: 8.15.4
APP VERSION: 0.66.0

** Please be patient while the chart is being deployed **

Watch the Prometheus Operator Deployment status using the command:

    kubectl get deploy -w --namespace monitoring -l app.kubernetes.io/name=kube-prometheus-operator,app.kubernetes.io/instance=prometheus

Watch the Prometheus StatefulSet status using the command:

    kubectl get sts -w --namespace monitoring -l app.kubernetes.io/name=kube-prometheus-prometheus,app.kubernetes.io/instance=prometheus

Prometheus can be accessed via port "9090" on the following DNS name from within your cluster:

    prometheus-kube-prometheus-prometheus.monitoring.svc.cluster.local

To access Prometheus from outside the cluster execute the following commands:

    echo "Prometheus URL: http://127.0.0.1:9090/"
    kubectl port-forward --namespace monitoring svc/prometheus-kube-prometheus-prometheus 9090:9090

Watch the Alertmanager StatefulSet status using the command:

    kubectl get sts -w --namespace monitoring -l app.kubernetes.io/name=kube-prometheus-alertmanager,app.kubernetes.io/instance=prometheus

Alertmanager can be accessed via port "9093" on the following DNS name from within your cluster:

    prometheus-kube-prometheus-alertmanager.monitoring.svc.cluster.local

To access Alertmanager from outside the cluster execute the following commands:

    echo "Alertmanager URL: http://127.0.0.1:9093/"
    kubectl port-forward --namespace monitoring svc/prometheus-kube-prometheus-alertmanager 9093:9093

root@ctrl:~# kubectl get pods -n monitoring -o wide
NAME                                                            READY   STATUS    RESTARTS   AGE   IP                NODE                   NOMINATED NODE     READINESS GATES
alertmanager-prometheus-kube-prometheus-alertmanager-0          2/2     Running   0          64s   192.168.211.146   snode02.bizantum.lab   <none>       <none>
prometheus-kube-prometheus-blackbox-exporter-6bc45966c9-g2jpf   1/1     Running   0          90s   192.168.211.144   snode02.bizantum.lab   <none>       <none>
prometheus-kube-prometheus-operator-7557fb45f9-cpq5g            1/1     Running   0          90s   192.168.211.145   snode02.bizantum.lab   <none>       <none>
prometheus-kube-state-metrics-54888d8f94-kmxz4                  1/1     Running   0          90s   192.168.186.70    snode01.bizantum.lab   <none>       <none>
prometheus-node-exporter-ppq52                                  1/1     Running   0          90s   10.0.0.71         snode01.bizantum.lab   <none>       <none>
prometheus-node-exporter-wr97b                                  1/1     Running   0          90s   10.0.0.72         snode02.bizantum.lab   <none>       <none>
prometheus-prometheus-kube-prometheus-prometheus-0              2/2     Running   0          64s   192.168.211.147   snode02.bizantum.lab   <none>       <none>

# if access from outside of cluster, set port-forwarding
root@ctrl:~# kubectl port-forward -n monitoring service/prometheus-kube-prometheus-prometheus --address 0.0.0.0 9090:9090
Step [3]If you deploy Grafana, too, It's possible like follows.
# output config and change some settings
root@ctrl:~# helm inspect values bitnami/grafana > grafana.yaml
root@ctrl:~# vi grafana.yaml
# line 555 : change to your [storageClass]
persistence:
  enabled: true
  ## If defined, storageClassName: <storageClass>
  ## If set to "-", storageClassName: "", which disables dynamic provisioning
  ## If undefined (the default) or set to null, no storageClassName spec is
  ##   set, choosing the default provisioner.  (gp2 on AWS, standard on
  ##   GKE, AWS & OpenStack)
  ##
  storageClass: "nfs-client"

root@ctrl:~# helm install grafana --namespace monitoring -f grafana.yaml bitnami/grafana
NAME: grafana
LAST DEPLOYED: Fri Jul 28 01:56:16 2023
NAMESPACE: monitoring
STATUS: deployed
REVISION: 1
TEST SUITE: None
NOTES:
CHART NAME: grafana
CHART VERSION: 9.0.5
APP VERSION: 10.0.3

** Please be patient while the chart is being deployed **

1. Get the application URL by running these commands:
    echo "Browse to http://127.0.0.1:8080"
    kubectl port-forward svc/grafana 8080:3000 &

2. Get the admin credentials:

    echo "User: admin"
    echo "Password: $(kubectl get secret grafana-admin --namespace monitoring -o jsonpath="{.data.GF_SECURITY_ADMIN_PASSWORD}" | base64 -d)"

root@ctrl:~# kubectl get pods -n monitoring
NAME                                                           READY   STATUS    RESTARTS      AGE
grafana-5c9cc5b8d9-zr4qf                                        1/1    Running   0             56s
.....
.....

# if access from outside of cluster, set port-forwarding
root@ctrl:~# kubectl port-forward -n monitoring service/grafana --address 0.0.0.0 3000:3000
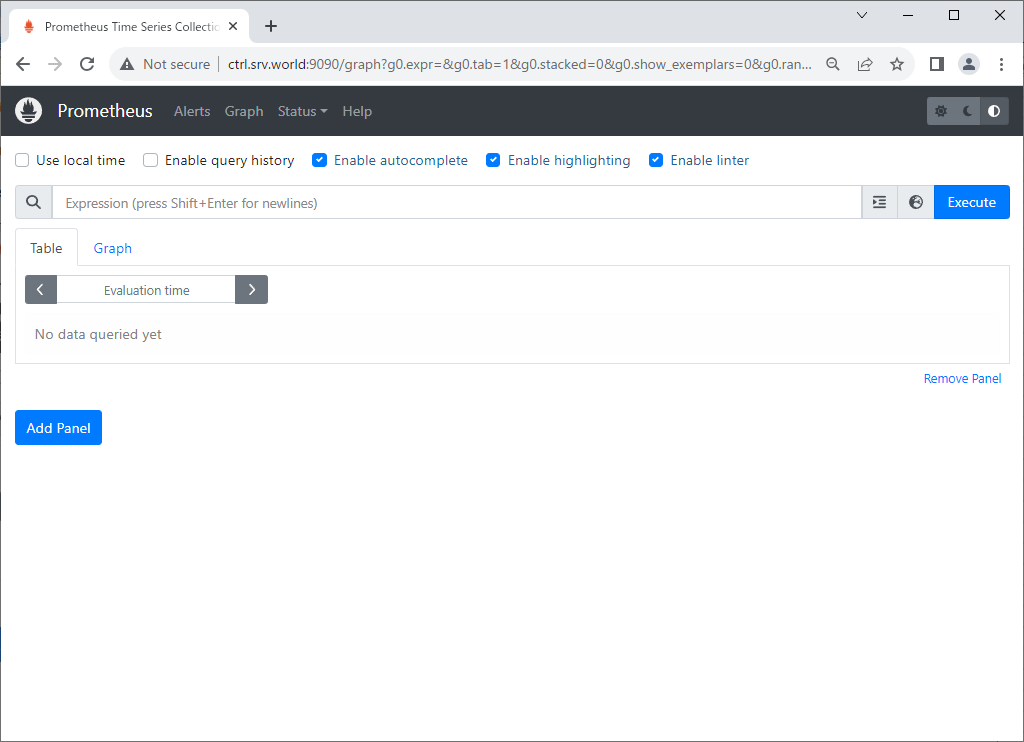
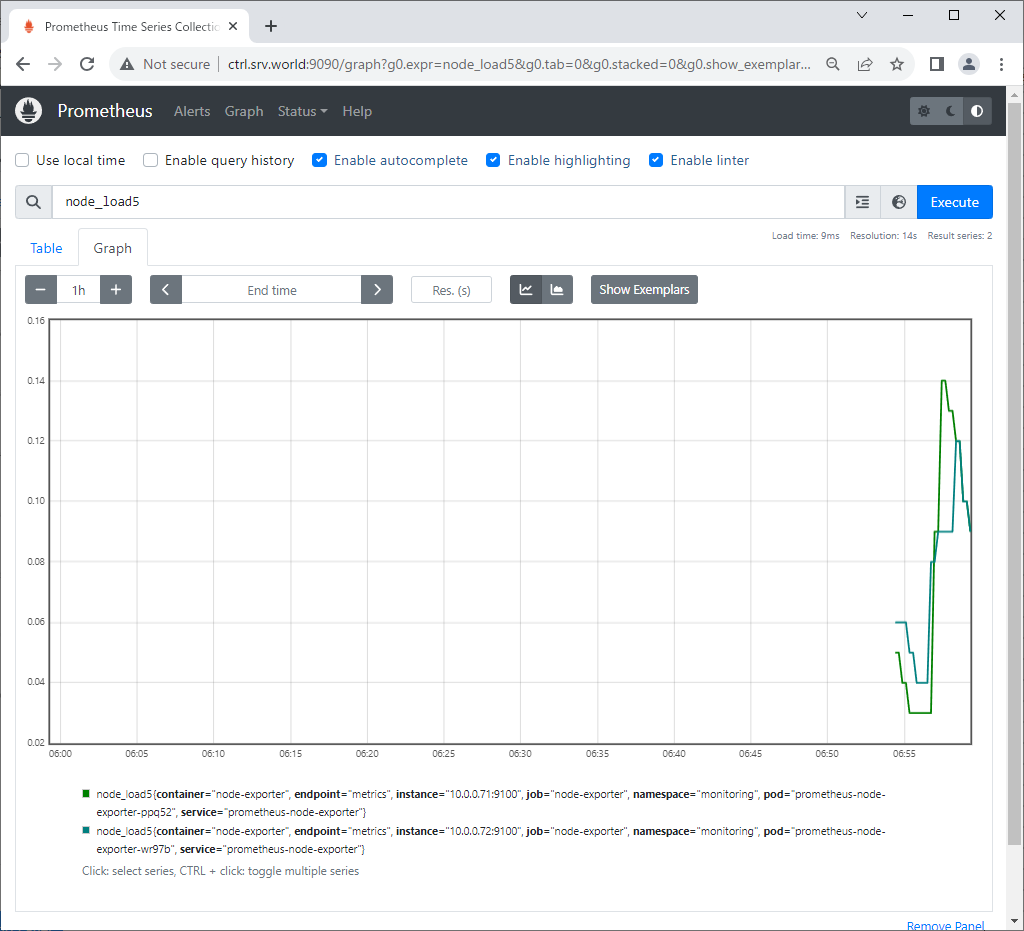
Step [4]If you access to Prometheus UI from a Host in cluster, access to the URL below with an Web browser. ⇒ http://prometheus-kube-prometheus-prometheus.monitoring.svc.cluster.local If you set port-forwarding, access to the URL below on a client computer in your local network. ⇒ http://(Control Plane Node Hostname or IP address):(setting port)/ That's OK if following Prometheus UI is displayed.
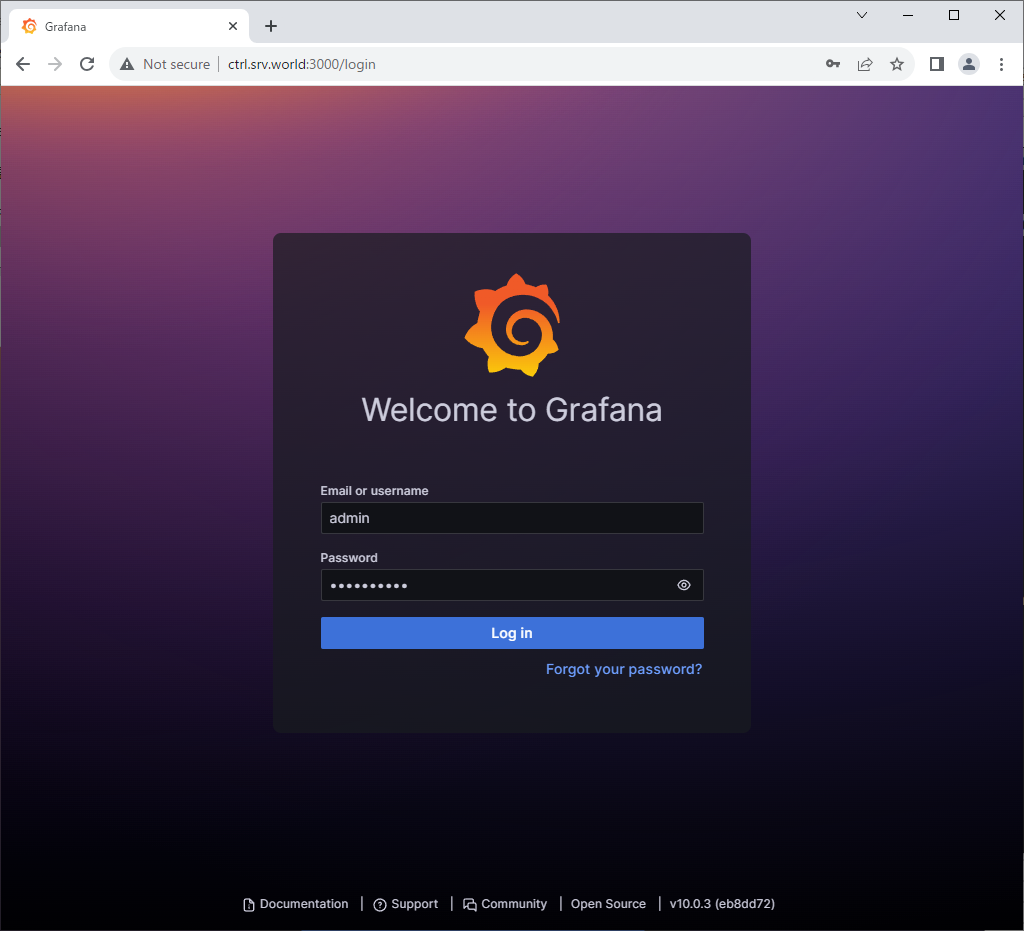
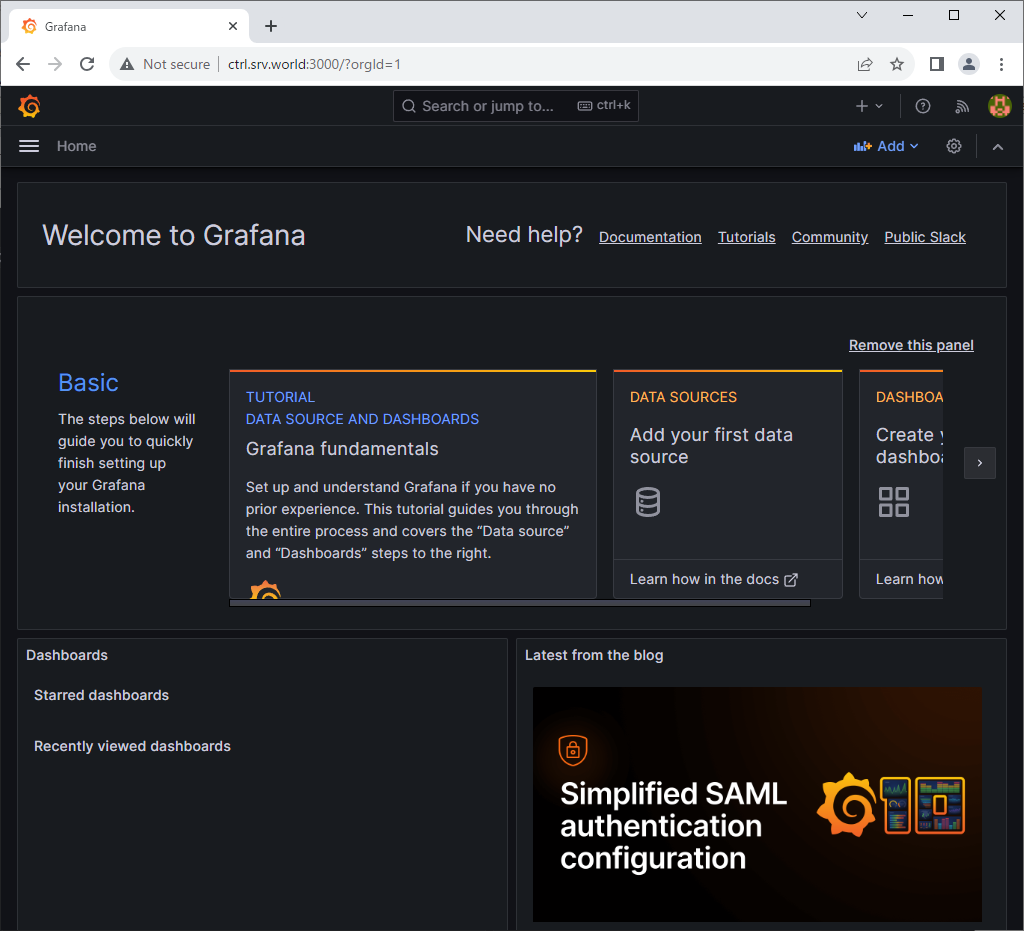
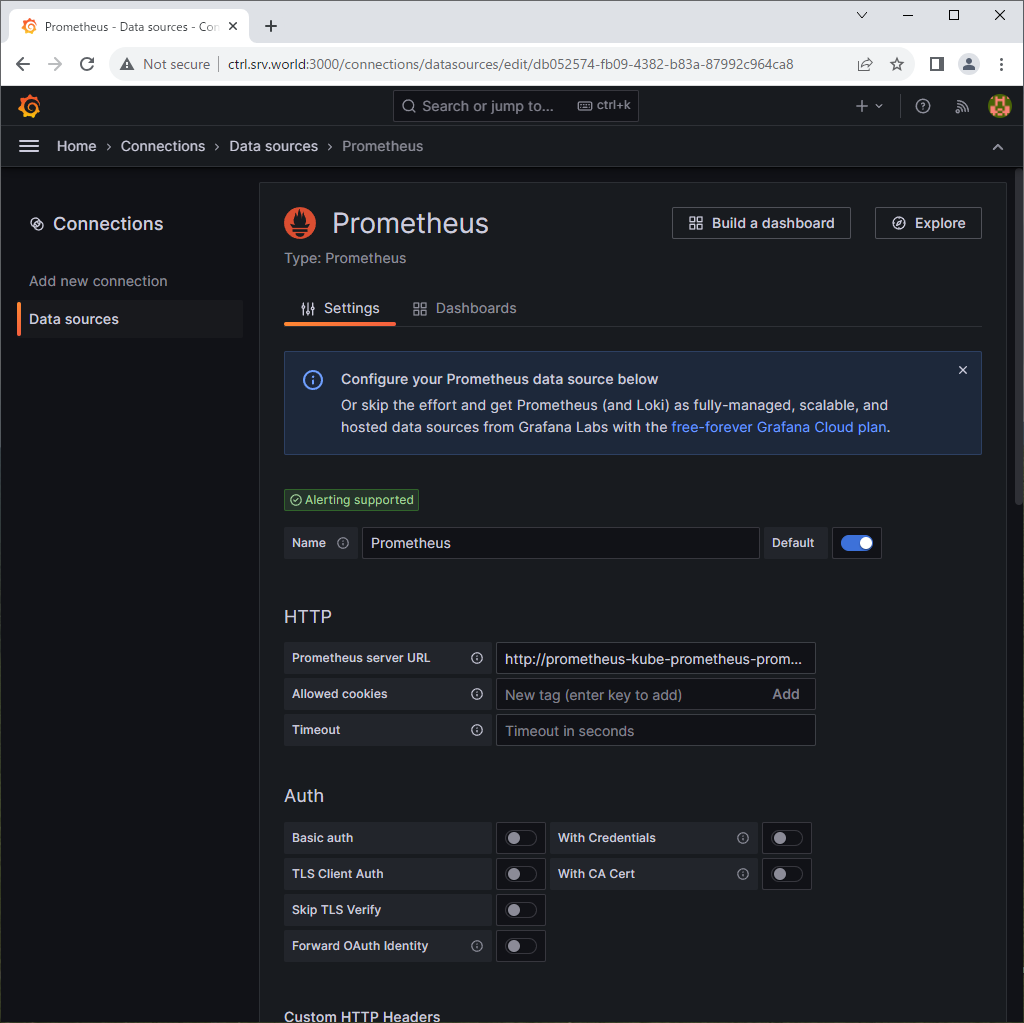
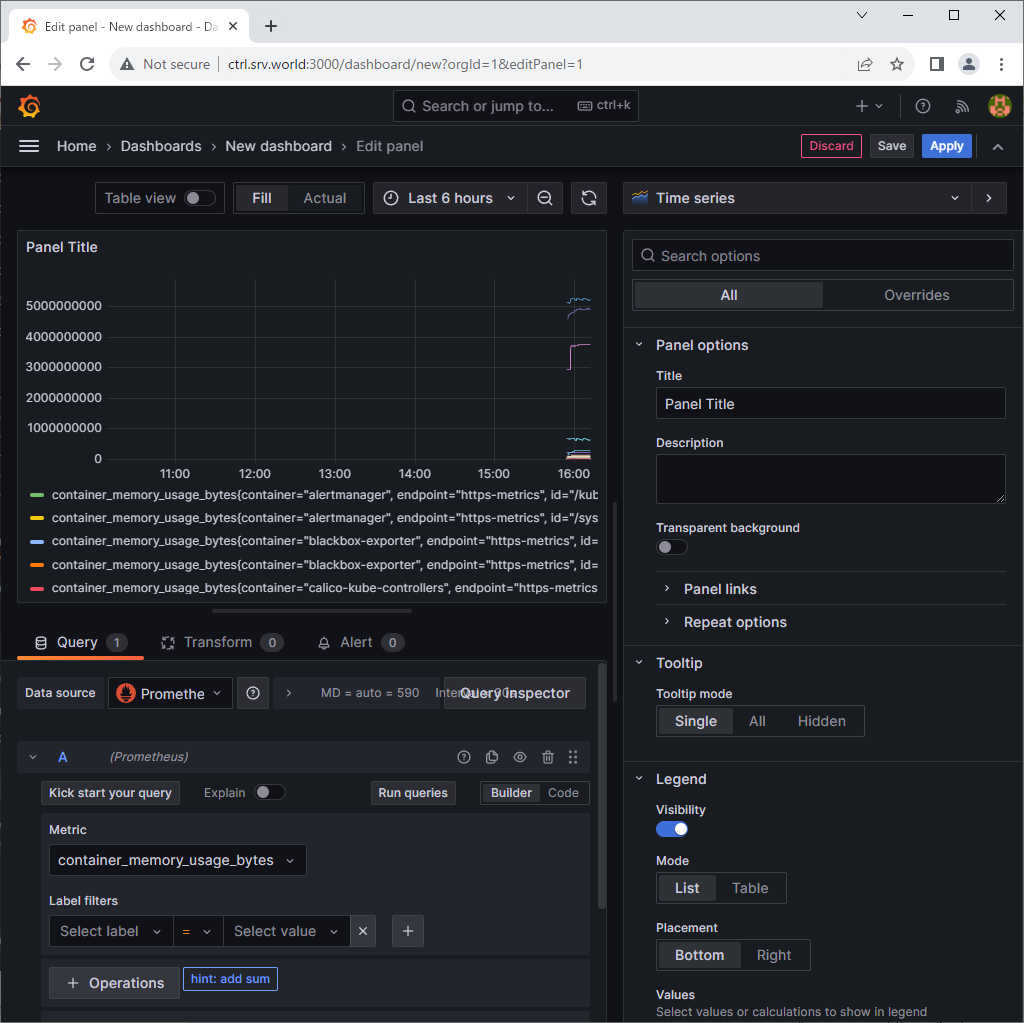
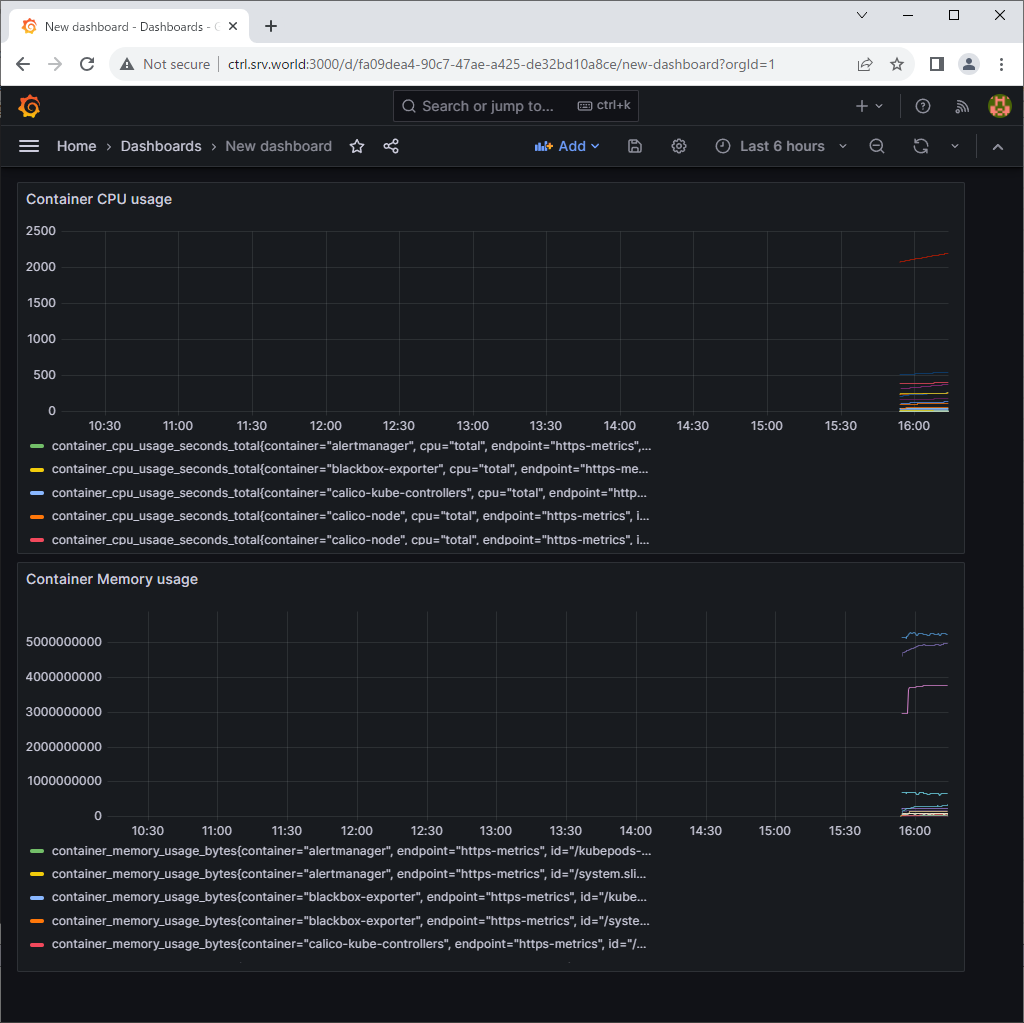
Step [5] If you access to Grafana from a Host in cluster, access to the URL below with an Web browser. ⇒ http://grafana.monitoring.svc.cluster.local If you set port-forwarding, access to the URL below on a client computer in your local network. ⇒ http://(Control Plane Node Hostname or IP address):(setting port)/ That's OK if following Grafana UI is displayed. For [admin] password, it's possible to confirm with the command below. ⇒ echo "Password: $(kubectl get secret grafana-admin --namespace monitoring -o jsonpath="{.data.GF_SECURITY_ADMIN_PASSWORD}" | base64 -d)"
- Get link
- X
- Other Apps


Comments
Post a Comment
Thank you for your comment! We appreciate your feedback, feel free to check out more of our articles.
Best regards, Bizantum Blog Team.